
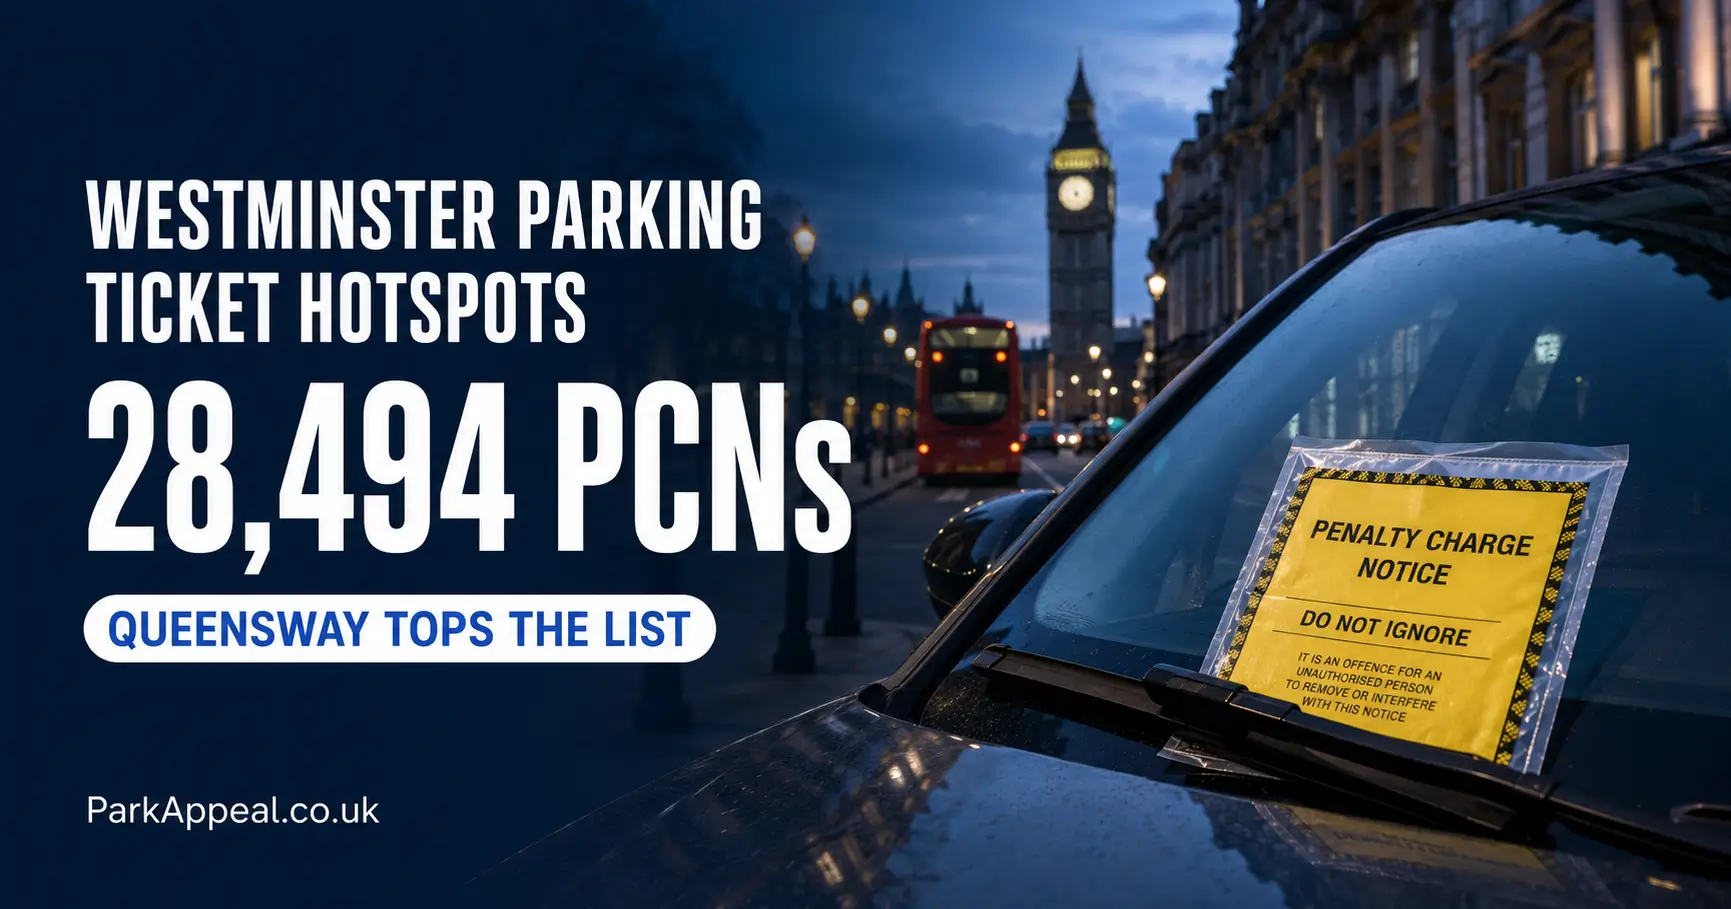
ParkAppeal obtained Freedom of Information data from Westminster City Council revealing the busiest on-street parking ticket locations across 2023/24, 2024/25 and 2025/26.
New Freedom of Information data obtained from Westminster City Council has revealed 151,228 on-street parking Penalty Charge Notices across the city’s annual top-10 hotspot lists over three financial years.
Queensway ranked first in every year and accumulated 28,494 PCNs – approximately 26 tickets a day across the full period. The council recorded £3,844,510 in initial debt against those notices.
Across all 30 annual ranking positions, the supplied PCNs carried a combined £20,100,810 in initial debt. This is the council’s full-value starting figure for the notices, not the amount it ultimately collected.
The request covered council-issued on-street parking PCNs only. It excluded off-street council car parks, bus lane PCNs, moving traffic PCNs, Clean Air Zone charges, littering penalties and private parking charges.
Last updated: 17 July 2026
Media summary
Freedom of Information data supplied by Westminster City Council shows 151,228 on-street parking PCNs and £20,100,810 in initial debt across the 30 annual entries in its top-10 lists for 2023/24, 2024/25 and 2025/26.
Queensway was Westminster’s biggest recurring hotspot, ranking first in all three years and accounting for 28,494 PCNs and £3,844,510 in initial debt. Its three-year count equates to approximately 26 tickets every day.
The annual top-10 total increased from 44,813 PCNs in 2023/24 to 56,677 in 2025/26, a rise of 26.5%. The latest list averaged approximately 155.3 PCNs per day across its 10 locations.
Only 15 unique streets or locations filled the 30 annual ranking positions. Six appeared in every year and together accounted for 103,518 PCNs, or 68.5% of the supplied total.
Code 12 – broadly covering a residents’ or shared-use parking place without the required permit, ticket, voucher or payment – was the largest contravention family, with 44,591 PCNs. Code 11 tickets for parking without payment were 130.3% higher in the latest year than in 2023/24.
The £20.1 million figure is not council revenue. It is the sum of the “Initial Debt” totals supplied by Westminster City Council and does not account for early-payment discounts, cancellations, successful challenges, non-payment or later enforcement outcomes.
Key findings from Westminster City Council’s FOI response
Why £20.1 million is not revenue received by Westminster City Council
Westminster City Council’s tables include an “Initial Debt” figure for each street and contravention. The £20,100,810 total in this report is the sum of those council-supplied figures – it is not an estimate created by ParkAppeal.
Initial debt does not show how much money Westminster City Council ultimately received. PCNs may be paid at a 50% discount, cancelled, successfully challenged, left unpaid or moved to a later enforcement stage.
Queensway recorded 28,494 PCNs – approximately 26 every day
Queensway ranked first in each annual list supplied by Westminster City Council. Its results were:
- 9,039 PCNs and £1,139,470 in initial debt in 2023/24
- 9,806 PCNs and £1,220,530 in initial debt in 2024/25
- 9,649 PCNs and £1,484,510 in initial debt in 2025/26
That gives a three-year total of 28,494 PCNs, representing 18.8% of all notices across the supplied annual lists. The count averages almost exactly 26 PCNs a day across the 1,096-day period.
Queensway’s dominant contravention was code 02, covering parking or loading/unloading in a restricted street where waiting and loading restrictions were in force. It accounted for 20,513 PCNs, or 72.0% of Queensway’s three-year total.
Latest-year headline: Queensway recorded 9,649 PCNs in 2025/26 – approximately 26.4 every day – with £1,484,510 in initial debt attached to those notices.
Westminster City Council’s annual top-10 ticket count rose by 26.5%
The 10 highest locations supplied for each financial year totalled:
- 44,813 PCNs in 2023/24 – £5,598,490 in initial debt
- 49,738 PCNs in 2024/25 – £5,931,290 in initial debt
- 56,677 PCNs in 2025/26 – £8,571,030 in initial debt
The top-10 count increased by 11.0% in 2024/25 and by a further 14.0% in 2025/26. From the first year to the latest, it rose by 11,864 PCNs, or 26.5%.
On a daily basis, the annual top-10 locations averaged approximately 122.4 PCNs in 2023/24, 136.3 in 2024/25 and 155.3 in 2025/26.
Penalty levels rose during the latest financial year
Initial debt across the annual top-10 list increased by 53.1% between 2023/24 and 2025/26 – considerably faster than the 26.5% growth in the number of PCNs.
Part of that difference reflects a change in London penalty levels. According to London Councils, borough parking penalties increased by £30 from 7 April 2025. In Band A, which includes Westminster, higher-level penalties rose from £130 to £160 and lower-level penalties rose from £80 to £110.
The latest year’s £8.57 million initial-debt total therefore reflects both a higher number of tickets and higher full penalty levels. It should not be interpreted as a like-for-like measure of enforcement volume or money collected.
Only 15 locations filled all 30 annual ranking positions
Six locations appeared in every annual list: Queensway, Wardour Street, Great Marlborough Street, Oxendon Street, Mount Street and Rupert Street.
Together, these six recurring hotspots accounted for 103,518 PCNs – 68.5% of all notices in the supplied dataset – and £13,946,660 in initial debt.
Queensway and Wardour Street alone recorded 47,202 PCNs, or 31.2% of the supplied total, with combined initial debt of £6,389,590.
Only nine other locations appeared anywhere in the three lists. South Wharf Road and Inverness Terrace featured in the two latest years, while Garrick Street appeared in the first and latest lists. Stratton Street, New Bond Street, Berkeley Street, Berkeley Square, Dean Street and Hertford Street each appeared once. Berkeley Street and Berkeley Square have been treated as separate locations because that is how Westminster City Council supplied them.
Highest cumulative parking ticket hotspots in Westminster
| Street or location | Years in top 10 | PCNs | Initial debt |
|---|---|---|---|
| Queensway (B3) | 3 | 28,494 | £3,844,510 |
| Wardour Street (G1) | 3 | 18,708 | £2,545,080 |
| Great Marlborough Street (G1) | 3 | 15,996 | £2,172,210 |
| Oxendon Street (G1) | 3 | 15,110 | £2,075,850 |
| Mount Street (E1) | 3 | 12,624 | £1,587,480 |
| Rupert Street (G1) | 3 | 12,586 | £1,721,530 |
| South Wharf Road (B5) | 2 | 9,435 | £1,142,380 |
| Garrick Street (G1) | 2 | 7,848 | £1,116,340 |
| Inverness Terrace (B3) | 2 | 7,838 | £1,079,540 |
| Hertford Street (E1) | 1 | 4,053 | £630,710 |
Ranked by cumulative PCN count across the annual lists. A location appearing once was only present in one year’s top 10 and may still have received PCNs in other years.
Residents’ and shared-use bay contraventions were the largest category
Westminster City Council supplied the individual contravention-code counts for every location. ParkAppeal grouped them by their main two-digit code to identify the largest themes across the 151,228 PCNs.
| Code family | General description | PCNs | Share of supplied total |
|---|---|---|---|
| 12 | Residents’ or shared-use place without the required permit, ticket, voucher or payment | 44,591 | 29.5% |
| 02 | Restricted street where waiting and loading restrictions were in force | 34,964 | 23.1% |
| 01 | Parked in a restricted street during prescribed hours | 23,062 | 15.2% |
| 11 | Parked without payment of the parking charge | 17,253 | 11.4% |
| 45 | Stopped or waited on a taxi rank | 11,519 | 7.6% |
| 21 | Parked wholly or partly in a suspended bay or space | 5,301 | 3.5% |
Code 12 was the largest family overall, accounting for 44,591 PCNs, or 29.5% of the supplied total. The six largest code families together accounted for 90.4% of all PCNs in the dataset.
Code 12 rose from 12,572 PCNs in 2024/25 to 18,620 in 2025/26, a one-year increase of 48.1%. Code 01 also rose sharply in the latest year, increasing by 21.7% from 7,078 to 8,615.
Code 11 tickets for parking without payment increased from 2,916 in 2023/24 to 6,716 in 2025/26. That is a 130.3% increase between the first and latest years, although the latest count was lower than the 7,621 recorded in 2024/25.
These comparisons relate only to the streets included in each year’s top 10. Because the composition of the list changed, they should not be treated as borough-wide trends.
Top Westminster parking ticket locations by year
The tables below reproduce Westminster City Council’s top 10 on-street parking PCN locations for each financial year, together with the council-supplied initial-debt totals.
2023/24
| Street or location | PCNs issued | Initial debt* |
|---|---|---|
| Queensway (B3) | 9,039 | £1,139,470 |
| Wardour Street (G1) | 5,555 | £701,600 |
| Great Marlborough Street (G1) | 4,463 | £560,790 |
| Stratton Street (E1) | 3,867 | £476,910 |
| Mount Street (E1) | 3,832 | £445,210 |
| Garrick Street (G1) | 3,734 | £474,270 |
| New Bond Street (E1) | 3,712 | £461,410 |
| Oxendon Street (G1) | 3,602 | £461,410 |
| Berkeley Street (E1) | 3,531 | £436,880 |
| Rupert Street (G1) | 3,478 | £440,540 |
2024/25
| Street or location | PCNs issued | Initial debt* |
|---|---|---|
| Queensway (B3) | 9,806 | £1,220,530 |
| Oxendon Street (G1) | 5,966 | £756,380 |
| Wardour Street (G1) | 5,636 | £693,380 |
| Great Marlborough Street (G1) | 5,040 | £618,850 |
| Mount Street (E1) | 4,599 | £530,870 |
| Rupert Street (G1) | 3,912 | £486,560 |
| Berkeley Square (E1) | 3,788 | £361,290 |
| South Wharf Road (B5) | 3,723 | £374,390 |
| Dean Street (G1) | 3,638 | £448,690 |
| Inverness Terrace (B3) | 3,630 | £440,350 |
2025/26
| Street or location | PCNs issued | Initial debt* |
|---|---|---|
| Queensway (B3) | 9,649 | £1,484,510 |
| Wardour Street (G1) | 7,517 | £1,150,100 |
| Great Marlborough Street (G1) | 6,493 | £992,570 |
| South Wharf Road (B5) | 5,712 | £767,990 |
| Oxendon Street (G1) | 5,542 | £858,060 |
| Rupert Street (G1) | 5,196 | £794,430 |
| Inverness Terrace (B3) | 4,208 | £639,190 |
| Mount Street (E1) | 4,193 | £611,400 |
| Garrick Street (G1) | 4,114 | £642,070 |
| Hertford Street (E1) | 4,053 | £630,710 |
*Initial debt is the full-value starting figure supplied by Westminster City Council. It is not the amount paid or retained by the council.
Drivers should carefully check a PCN before paying
A high volume of PCNs at one location does not mean the tickets were issued incorrectly. Busy roads, loading restrictions, resident bays, taxi ranks, pay-to-park spaces and enforcement levels can all affect how many notices are issued.
However, a driver who receives a PCN should check the contravention code, the stated location, the date and time, the signs and road markings, and any payment, permit, loading or exemption evidence before deciding what to do.
If the details are wrong, the restriction was not clearly signed, evidence supports an exemption, or the council did not follow the correct process, there may be grounds to challenge the notice.
Comment from ParkAppeal
A ParkAppeal spokesperson said: “Queensway stands out even among Westminster City Council’s busiest parking ticket locations. It ranked first in every year, with 28,494 PCNs across the period – almost exactly 26 tickets every day.
“The wider trend is also striking. The number of PCNs across the annual top 10 rose by 26.5% between the first and latest years, while just six recurring locations accounted for more than two-thirds of the entire dataset.”
For journalists and media enquiries
This report can be referenced as a ParkAppeal Freedom of Information analysis of Westminster City Council’s top on-street parking PCN locations.
- Suggested headline: Queensway recorded 28,494 parking tickets as Westminster hotspots reached £20.1m in initial debt
- FOI authority: Westminster City Council
- FOI reference: 45898761
- Scope: council-issued on-street parking PCNs at the annual top-10 locations only
- Financial years: 2023/24, 2024/25 and 2025/26
- Main finding: 151,228 PCNs and £20,100,810 in initial debt across the three annual top-10 lists
- Key hotspot: Queensway ranked first in all three years, recording 28,494 PCNs and £3,844,510 in initial debt
- Daily finding: Queensway averaged approximately 26 PCNs a day across the three years
- Latest-year finding: the 10 supplied hotspots recorded 56,677 PCNs, approximately 155.3 per day
- Trend finding: the annual top-10 count rose by 26.5% between 2023/24 and 2025/26
- Concentration finding: six locations appearing in every year accounted for 68.5% of all supplied PCNs
- Contravention finding: code 12 was the largest family, with 44,591 PCNs
- Value note: £20.1 million is council-supplied initial debt, not revenue or money collected
For comment or media enquiries, please contact ParkAppeal through the ParkAppeal contact page.
Need help challenging a parking ticket?
Answer a few simple questions about your parking ticket, what happened and any evidence you have. ParkAppeal can help create a structured appeal letter for you to review and submit yourself.
Create Appeal Letter →Disclaimer
ParkAppeal is not a law firm and does not provide legal advice. Our software generates appeal letters for drivers to review and submit themselves. ParkAppeal is independent and is not affiliated with Westminster City Council or any parking operator.
Whether a parking appeal is accepted depends on the facts, evidence, the relevant authority or operator, and the process used. The figures in this article are based on Westminster City Council’s Freedom of Information response. Initial-debt values should not be treated as final income received by the council.