
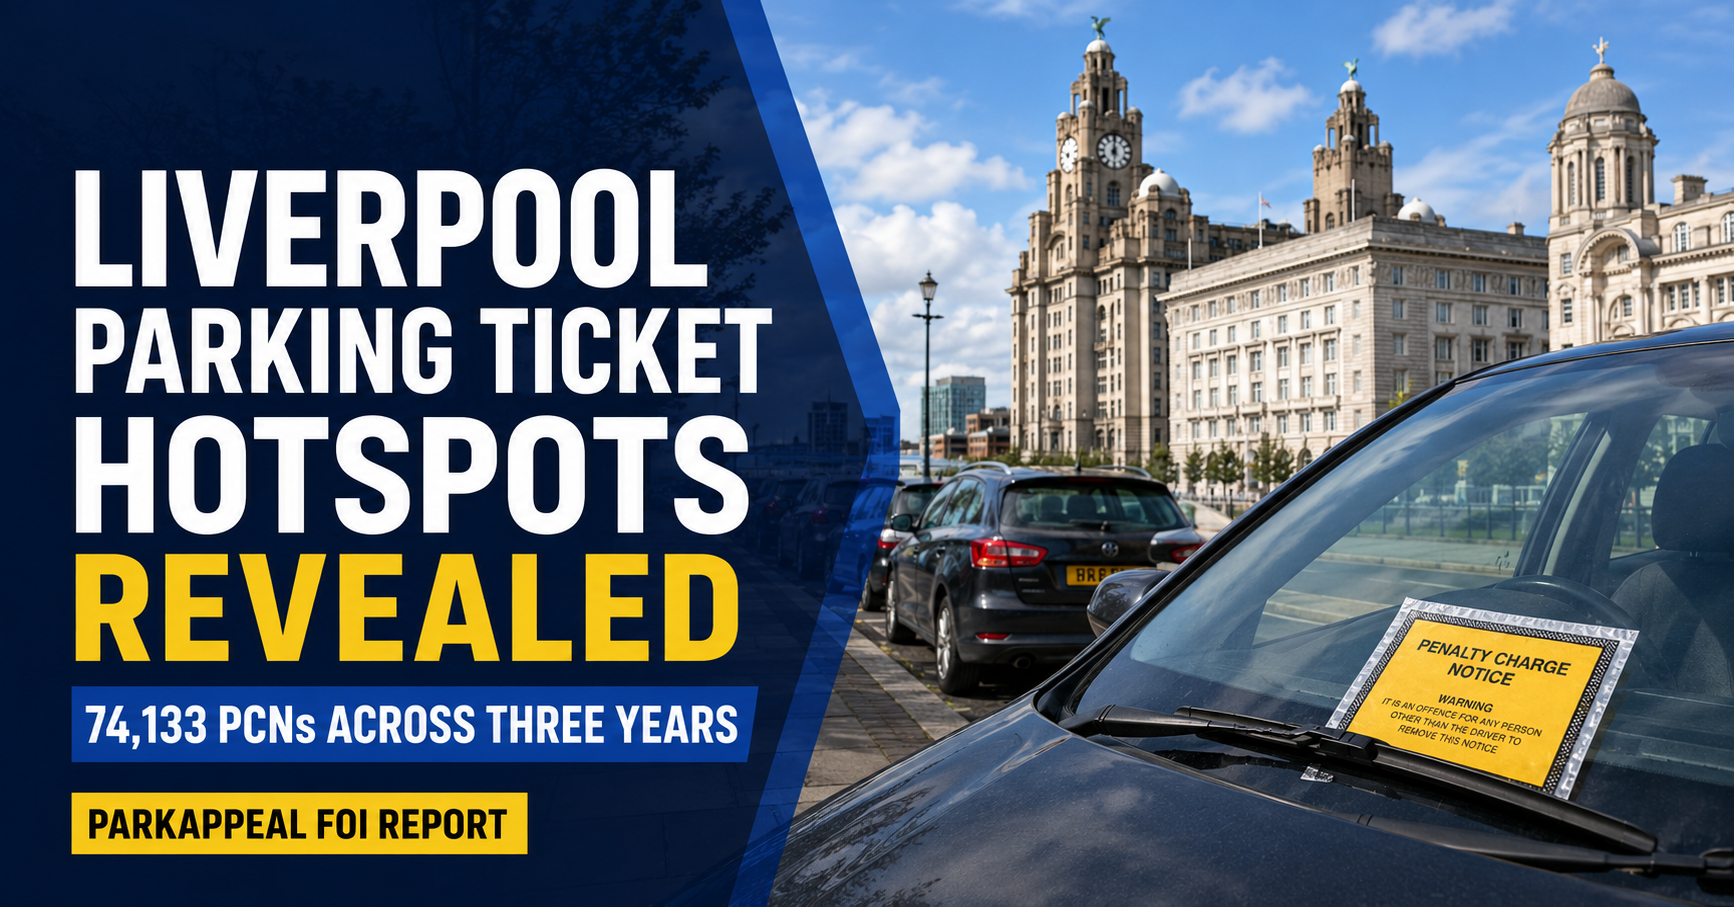
ParkAppeal obtained Freedom of Information data from Liverpool City Council revealing the city’s busiest on-street parking ticket locations across 2023/24, 2024/25 and 2025/26.
New Freedom of Information data obtained from Liverpool City Council has revealed 74,133 on-street parking Penalty Charge Notices across the city’s annual top-10 hotspot lists over three financial years – with just 13 unique streets or locations filling all 30 annual ranking positions.
Crown Street recorded more tickets than any other location across the three supplied lists, with 10,024 PCNs – more than one in eight of all notices in the dataset. It topped the ranking in both 2024/25 and 2025/26, reaching 3,888 PCNs in the latest year, approximately 10.7 tickets a day.
Using the standard £50 lower-level and £70 higher-level charges identified in the council’s response, ParkAppeal estimates that the PCNs across the supplied hotspot lists carried a potential full-value total of £4,643,350. This is a calculated face-value estimate, not the amount collected by the council.
The request covered council-issued on-street parking PCNs only. It excluded off-street council car parks, bus lane PCNs, moving traffic PCNs, Clean Air Zone charges, littering penalties and private parking charges.
Last updated: 16 July 2026
Media summary
Freedom of Information data supplied by Liverpool City Council shows 74,133 on-street parking PCNs across the 30 annual hotspot entries in its top-10 lists for 2023/24, 2024/25 and 2025/26. Only 13 unique streets or locations appeared across those 30 positions.
Crown Street was Liverpool’s biggest recurring hotspot, accounting for 10,024 PCNs across the three lists and an estimated £701,460 at standard full penalty rates. Its count climbed by 31.2% in the latest year, from 2,963 to 3,888.
The annual top-10 total fell from 26,368 PCNs in 2023/24 to 21,905 in 2024/25, before rebounding by 18.1% to 25,860 in 2025/26.
The pattern of contraventions changed sharply. Code 06 tickets for having no valid pay-and-display ticket or voucher clearly displayed rose by 55.2% between the first and latest years and became the largest code family, while taxi-rank code 45 tickets fell by 70.3%.
At the standard full £50 and £70 penalty rates specified in the response, the supplied PCNs equate to an estimated £4,643,350 in potential full-value charges. This ParkAppeal calculation is not council revenue: it does not account for early-payment discounts, cancellations, successful appeals, non-payment or later enforcement outcomes.
Key findings from the Liverpool FOI response
Crown Street was Liverpool’s biggest three-year parking ticket hotspot
Crown Street appeared in the top two in every annual list supplied by Liverpool City Council. It ranked second in 2023/24 before moving into first place in each of the next two years.
- 3,173 PCNs in 2023/24
- 2,963 PCNs in 2024/25
- 3,888 PCNs in 2025/26
That gives a three-year total of 10,024 PCNs, the highest cumulative count of any location in the supplied data and 13.5% of all PCNs across the three annual lists. At the standard full charge levels, the notices carried an estimated potential value of £701,460.
Crown Street’s dominant contravention was code 01, covering parking in a restricted street during prescribed hours. This code accounted for 8,141 PCNs, or 81.2% of the street’s three-year total. Its overall ticket count rose by 925 PCNs in the latest year alone – a 31.2% annual increase.
Latest-year headline: Crown Street’s 3,888 PCNs in 2025/26 work out at approximately 10.7 tickets per day, with an estimated potential value of £272,080 at standard full penalty rates.
Crown Street and Duke Street accounted for more than a quarter of the dataset
Duke Street topped Liverpool’s list in 2023/24 with 3,819 PCNs. Its count then fell to 2,314 in 2024/25 before rising to 3,223 in 2025/26.
Across all three years, Duke Street recorded 9,356 PCNs and an estimated £565,840 at standard full rates, placing it second behind Crown Street on the cumulative ranking.
Together, Crown Street and Duke Street accounted for 19,380 PCNs, or 26.1% of all notices across the supplied annual lists. Their combined estimated value at standard full rates was £1,267,300.
Code 06 – no valid pay-and-display ticket or voucher clearly displayed – was Duke Street’s largest code family, accounting for 3,865 PCNs. Taxi-rank code 45 was the next largest with 2,553.
Liverpool’s top-10 total rebounded after a one-year fall
The 10 highest locations supplied for each financial year totalled:
- 26,368 PCNs in 2023/24 – estimated full-value charges of £1,713,520
- 21,905 PCNs in 2024/25 – estimated full-value charges of £1,346,570
- 25,860 PCNs in 2025/26 – estimated full-value charges of £1,583,260
The annual top-10 total fell by 16.9% in 2024/25, then rose by 18.1% in 2025/26. Despite that rebound, the latest-year total remained 1.9% below the 2023/24 figure.
In 2025/26, the 10 supplied hotspot locations collectively averaged approximately 70.8 PCNs per day. This is the daily average for the annual top-10 locations only, not for every Liverpool street.
Just 13 locations filled all 30 annual hotspot positions
Seven locations appeared in all three annual lists: Crown Street, Duke Street, Seel Street, Stanley Street, North John Street, Old Hall Street and Brunswick Street.
Together, these seven recurring hotspots accounted for 56,171 PCNs – 75.8% of all tickets across the supplied dataset.
Only six other locations appeared anywhere in the three lists. Hope Street featured in both of the two most recent years, Copperas Hill appeared in the first two, and Henry Street featured in 2023/24 before returning in 2025/26. Hardman Street, Rodney Street and Sir Thomas Street each appeared once.
No-ticket PCNs rose as taxi-rank tickets fell
ParkAppeal grouped code variants by their main two-digit contravention code to identify the biggest themes across the 74,133 PCNs.
| Code family | General description | PCNs | Share of supplied total |
|---|---|---|---|
| 06 | No valid pay-and-display ticket or voucher clearly displayed | 22,602 | 30.5% |
| 45 | Stopped or waited on a taxi rank | 16,096 | 21.7% |
| 01 | Parked in a restricted street during prescribed hours | 15,784 | 21.3% |
| 25 | Loading place or bay during restricted hours without loading | 7,667 | 10.3% |
| 05 | Parked after the expiry of paid-for time | 4,363 | 5.9% |
| 02 | Restricted street with waiting and loading restrictions in force | 2,314 | 3.1% |
Code 06 was the largest family overall, accounting for 22,602 PCNs, or 30.5% of the supplied total. Its annual count rose from 5,890 in 2023/24 to 7,572 in 2024/25 and 9,140 in 2025/26 – an increase of 55.2% between the first and latest years. Its share of the annual hotspot total climbed from 22.3% to 35.3%.
By contrast, taxi-rank code 45 fell from 9,094 PCNs in 2023/24 to 4,298 in 2024/25 and 2,704 in 2025/26 – a reduction of 70.3% from the first year to the latest. Its share of the annual hotspot total dropped from 34.5% to 10.5%.
The suffixes attached to some codes provide additional context, but do not change the main code-family grouping used in this summary.
Almost two-thirds of PCNs were in higher-level code families
Liverpool City Council’s response stated that lower-level contraventions carried a standard full charge of £50, while higher-level contraventions carried a standard full charge of £70.
Across the supplied breakdown, 46,835 PCNs fell within higher-level code families and 27,298 fell within lower-level code families. Higher-level contraventions therefore accounted for 63.2% of the supplied tickets.
Multiplying the code-level counts by the applicable standard full charge produces an estimated potential value of £4,643,350 across the three annual hotspot lists.
Why £4.6 million is not council revenue
Liverpool City Council said that the total face value of the PCNs was not available in a reportable form. The £4.6 million figure was calculated by ParkAppeal from the contravention-code counts and the £50/£70 standard charge levels stated in the council’s response.
It does not show how much money the council received. Many PCNs may have been paid at a discounted rate, cancelled, successfully challenged, left unpaid or progressed to a different enforcement stage.
Top Liverpool parking ticket locations by year
The tables below show Liverpool City Council’s top 10 on-street parking PCN locations for each financial year. ParkAppeal calculated the estimated full-value charges from the code-level £50 and £70 rates supplied with the response.
2023/24
| Street or location | PCNs issued | Estimated full-value charges* |
|---|---|---|
| Duke Street (L1) | 3,819 | £237,290 |
| Crown Street (L7) | 3,173 | £222,090 |
| Seel Street (L1) | 3,136 | £206,900 |
| North John Street (L2) | 2,652 | £167,880 |
| Stanley Street (L1) | 2,504 | £154,580 |
| Hardman Street (L1) | 2,504 | £170,700 |
| Copperas Hill (L3, Inner Zone) | 2,454 | £165,440 |
| Brunswick Street (L2) | 2,224 | £141,640 |
| Old Hall Street (L3) | 2,070 | £118,760 |
| Henry Street (L1) | 1,832 | £128,240 |
2024/25
| Street or location | PCNs issued | Estimated full-value charges* |
|---|---|---|
| Crown Street (L7) | 2,963 | £207,290 |
| Stanley Street (L1) | 2,528 | £154,160 |
| North John Street (L2) | 2,484 | £155,400 |
| Seel Street (L1) | 2,363 | £151,430 |
| Duke Street (L1) | 2,314 | £138,500 |
| Old Hall Street (L3) | 2,143 | £121,390 |
| Hope Street (L1) | 2,065 | £107,090 |
| Copperas Hill (L3, Inner Zone) | 1,776 | £118,780 |
| Brunswick Street (L2) | 1,705 | £104,950 |
| Rodney Street (L1) | 1,564 | £87,580 |
2025/26
| Street or location | PCNs issued | Estimated full-value charges* |
|---|---|---|
| Crown Street (L7) | 3,888 | £272,080 |
| Duke Street (L1) | 3,223 | £190,050 |
| Stanley Street (L1) | 2,967 | £177,710 |
| North John Street (L2) | 2,804 | £172,000 |
| Seel Street (L1) | 2,653 | £168,910 |
| Old Hall Street (L3) | 2,630 | £150,200 |
| Hope Street (L1) | 2,087 | £107,630 |
| Sir Thomas Street (L1) | 2,037 | £116,790 |
| Brunswick Street (L2) | 1,928 | £112,880 |
| Henry Street (L1) | 1,643 | £115,010 |
*Estimated full-value charges are ParkAppeal calculations based on the standard £50 lower-level and £70 higher-level rates stated by Liverpool City Council. Figures are not actual council revenue.
Drivers should carefully check a PCN before paying
A high volume of PCNs at one location does not mean the tickets were issued incorrectly. Busy roads, loading restrictions, taxi ranks, pay-and-display bays, pedestrian crossings and enforcement levels can all affect how many notices are issued.
However, a driver who receives a PCN should check the contravention code, the stated location, the date and time, the signs and road markings, and any payment, permit, loading or exemption evidence before deciding what to do.
If the details are wrong, the restriction was not clearly signed, evidence supports an exemption, or the council did not follow the correct process, there may be grounds to challenge the notice.
Comment from ParkAppeal
A ParkAppeal spokesperson said: “Only 13 locations filled all 30 positions across Liverpool’s three annual top-10 lists, showing just how concentrated the city’s recurring parking ticket hotspots were. Crown Street stands out most clearly, with more than 10,000 PCNs across the period and almost 3,900 in the latest year alone.
“The changing mix of tickets is just as striking. PCNs for having no valid pay-and-display ticket or voucher clearly displayed rose by more than half between 2023/24 and 2025/26 and became the largest category, while taxi-rank tickets fell by around 70%.
“For drivers, the important point is to read the notice carefully rather than assuming every parking ticket is the same. The contravention code, signs, road markings and any payment or exemption evidence can all matter when deciding whether there are grounds to challenge.”
For journalists and media enquiries
This report can be referenced as a ParkAppeal Freedom of Information analysis of Liverpool City Council’s top on-street parking PCN locations.
- FOI authority: Liverpool City Council
- FOI reference: FOI-2026-1813
- Scope: council-issued on-street parking PCNs at the annual top-10 locations only
- Financial years: 2023/24, 2024/25 and 2025/26
- Main finding: 74,133 PCNs across the three annual top-10 lists
- Concentration finding: just 13 unique streets or locations filled all 30 annual hotspot positions
- Key hotspot: Crown Street recorded 10,024 PCNs across the period and ranked first in the two latest years
- Latest-year finding: Crown Street recorded 3,888 PCNs in 2025/26, approximately 10.7 per day
- Top-two finding: Crown Street and Duke Street accounted for 19,380 PCNs, or 26.1% of the supplied total
- Trend finding: code 06 tickets rose 55.2% from the first year to the latest, while taxi-rank code 45 tickets fell 70.3%
- Value note: approximately £4.64 million at standard full rates, calculated by ParkAppeal; this is not council revenue
For comment or media enquiries, please contact ParkAppeal through the ParkAppeal contact page.
Need help challenging a parking ticket?
Answer a few simple questions about your parking ticket, what happened and any evidence you have. ParkAppeal can help create a structured appeal letter for you to review and submit yourself.
Create Appeal Letter →Disclaimer
ParkAppeal is not a law firm and does not provide legal advice. Our software generates appeal letters for drivers to review and submit themselves. ParkAppeal is independent and is not affiliated with Liverpool City Council or any parking operator.
Whether a parking appeal is accepted depends on the facts, evidence, the relevant authority or operator, and the process used. The figures in this article are based on Liverpool City Council’s Freedom of Information response. Estimated values are calculated at standard full charge levels and should not be treated as final income received by the council.